"Net profit jumps 67%." That's the headline. Twenty minutes later someone on TV says the quarter was weak. Both can be true, and with a bit of practice you can see why for yourself in about fifteen minutes, straight from the company's own filing.
This guide walks through where to find quarterly results, which lines to read, and the questions that separate a genuinely good quarter from a flattering one.
Listed companies in India must file quarterly results with the stock exchanges. Under SEBI's listing rules, results are due within 45 days of the end of a quarter, and the full-year audited results within 60 days of the year-end. The Indian financial year runs April to March, so Q1 is April to June, Q2 is July to September, Q3 is October to December and Q4 is January to March.
Go to the company's page on the NSE or BSE website and open its corporate announcements or financial results section. You'll usually find:
Start with the filing. Read the notes at the bottom. That is where one-off items, accounting changes and auditor comments live.
Most companies publish two sets of numbers. Standalone covers only the listed company itself. Consolidated adds its subsidiaries and its share of joint ventures and associates.
For a company with big subsidiaries, standalone figures can be badly misleading; the action may be happening elsewhere in the group. As a default, read consolidated. In consolidated results, look at the profit "attributable to owners of the company", not the total, because part of a subsidiary's profit may belong to other shareholders (shown as non-controlling interest). Whichever you choose, compare like with like across quarters.
Sales from the company's actual business. This is the top line, and growth here is the first thing to check.
Interest on cash, dividends, gains on investments, sometimes rent. It is listed separately from revenue for a reason: it isn't the core business. A company sitting on a large cash pile can show rising profit while its operations stand still.
Earnings before interest, tax, depreciation and amortisation. Indian results statements don't always print an EBITDA line, but you can work it out: revenue from operations minus operating expenses (raw materials, employee costs and other expenses), before finance costs and depreciation, and without other income. Divide EBITDA by revenue and you get the EBITDA margin, which tells you how much of each rupee of sales the business keeps before financing and asset costs.
One-time gains or losses: selling a factory, a large write-off, a settlement. They can swing profit wildly. They are usually shown on a separate line and explained in the notes.
The bottom line, after everything. It is what headlines quote, and the number most affected by everything above.
Year-on-year (YoY) compares this quarter with the same quarter last year. Quarter-on-quarter (QoQ) compares it with the previous three months.
For seasonal businesses, YoY is the fairer test. An air-conditioner maker sells most in the summer months, so its April-June quarter will nearly always beat October-December. Consumer and auto companies often see a lift around the festive season. Comparing a festive quarter with a lean one, QoQ, will mislead you in either direction. QoQ is more useful for spotting a turn in trend in businesses that aren't very seasonal, like many IT services companies.
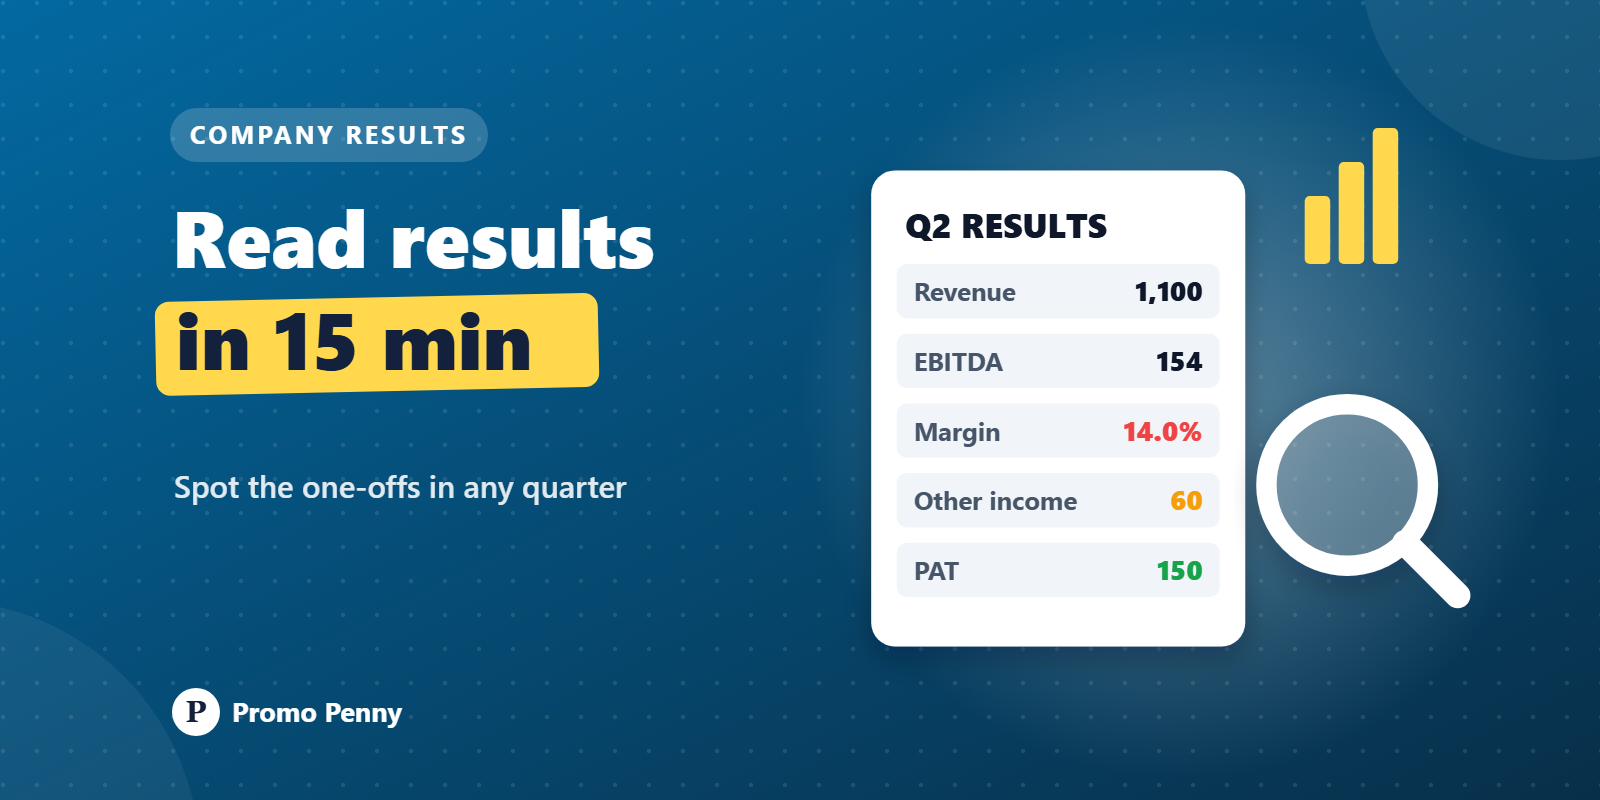
Here is a made-up company, Example Ltd, for its Q2. All figures in ₹ crore.
| Line | Q2 this year | Q2 last year |
|---|---|---|
| Revenue from operations | 1,100 | 1,000 |
| Operating expenses | 946 | 840 |
| EBITDA | 154 | 160 |
| EBITDA margin | 14.0% | 16.0% |
| Other income | 60 | 20 |
| Depreciation | 40 | 38 |
| Finance costs | 24 | 22 |
| Profit before exceptional items and tax | 150 | 120 |
| Exceptional gain | 50 | 0 |
| Profit before tax | 200 | 120 |
| Tax (assumed 25%) | 50 | 30 |
| PAT | 150 | 90 |
The headline writes itself: revenue up 10%, profit up 67%.
Now peel it back. Strip out the ₹50 crore exceptional gain and profit before tax is ₹150 crore; at the same 25% tax, PAT would be about ₹112 crore, up roughly 25%. Still decent. But look at where that came from. Other income tripled from ₹20 crore to ₹60 crore. EBITDA, the money the actual business made, fell from ₹160 crore to ₹154 crore, and the margin dropped two percentage points.
So the honest summary is: the company sold more, earned less on each sale, and made up for it with treasury income and a one-time gain. That is a very different quarter from "profit up 67%".
Do this for a company you already know for three or four quarters in a row, and the numbers start telling you a story before the headlines do.
This article is for general education only and is not investment advice or a recommendation about any company. The example company and figures are invented. Filing deadlines and formats are set by SEBI and the exchanges and can change.


































© 2026 Promo Penny. All rights reserved
Designed & Developed by IngeniousPro Team.