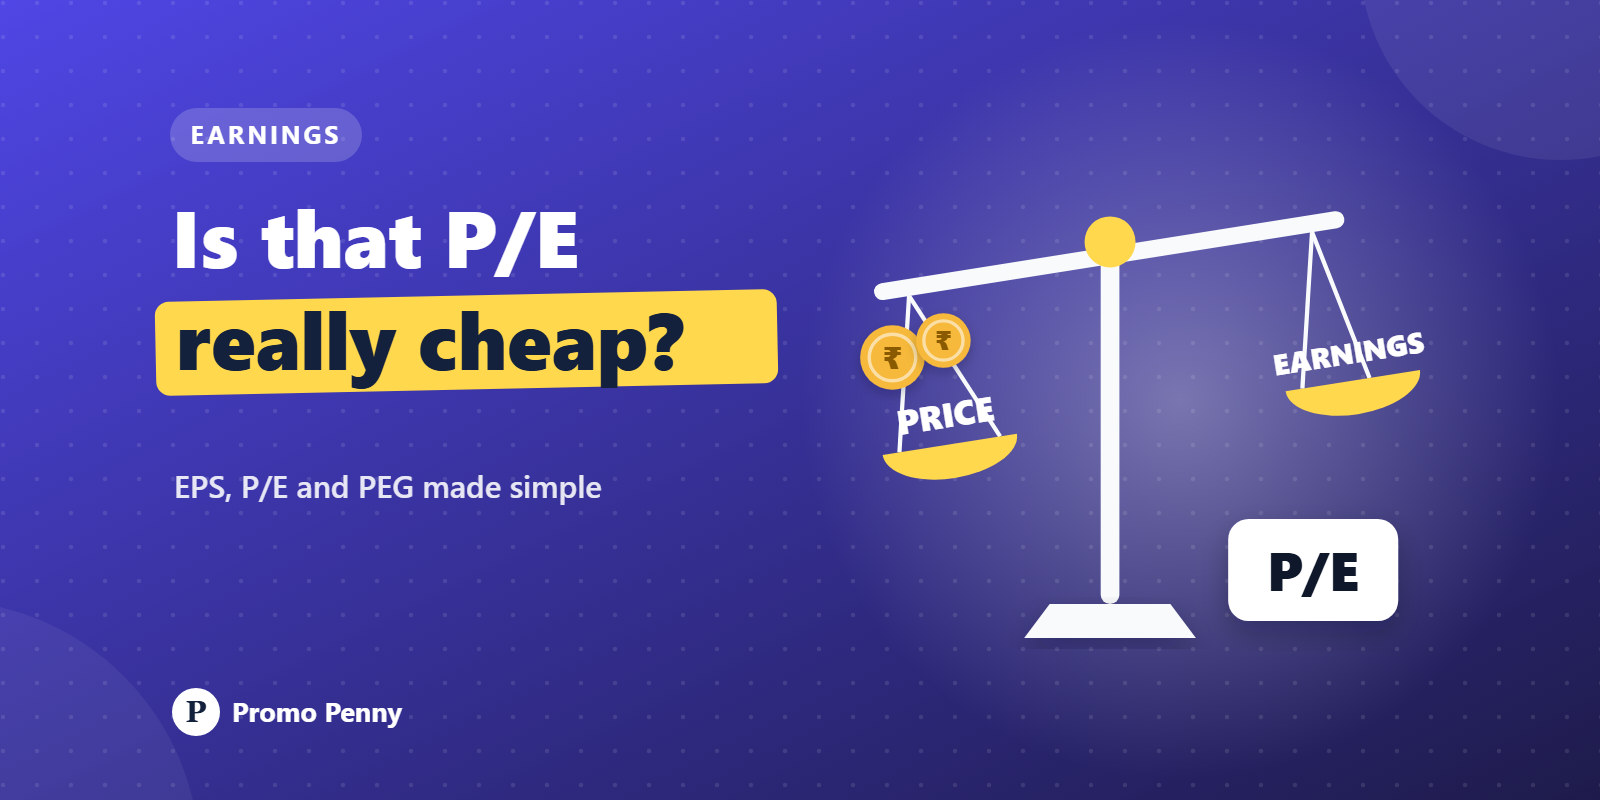
A friend tells you a stock is "cheap, only 8 times earnings". Another says a different one is "too expensive at 60 P/E". Neither statement means much until you know what those earnings are made of and where they are heading.
EPS, the P/E ratio and earnings growth are the three numbers people quote most. Here is what each one measures, where each one misleads, and how to use them together without fooling yourself.
Earnings per share is the company's net profit divided by the number of shares. More precisely, it is profit attributable to equity shareholders divided by the weighted average number of shares outstanding during the period.
Example: a company earns a net profit of ₹200 crore in a year and has 10 crore shares. EPS is ₹20.
Why not just look at profit? Because what you own is shares, not the company. If profit rises 10% but the company issued 20% more shares to raise money, each share's slice of the profit actually shrank. EPS catches that. It also works in reverse: a buyback reduces the share count and nudges EPS up even if profit is flat.
Basic EPS uses the shares that exist today. Diluted EPS also counts shares that could come into existence: employee stock options (ESOPs), convertible bonds, warrants.
Say our company has granted options that could become 50 lakh new shares. Diluted EPS is ₹200 crore divided by 10.5 crore shares, about ₹19.05. Both figures appear in the results. A small gap is normal. A large and growing gap, common in some young tech companies with generous stock options, means your share of future profit is being steadily diluted.
The price-to-earnings ratio is the share price divided by EPS. If the share trades at ₹400 and EPS is ₹20, P/E is 20. You are paying ₹20 for every ₹1 of annual profit.
Flip it around and you get the earnings yield: 1 divided by 20, or 5%. That's a handy way to compare a stock with what you'd earn on a fixed deposit, keeping in mind that profits can grow or shrink and FD interest is fixed.
Trailing P/E uses actual EPS from the last four quarters (often labelled TTM, trailing twelve months). It is based on real numbers but looks backwards.
Forward P/E uses estimated EPS for the next year, usually from analysts' forecasts. It looks ahead but rests on guesses, and forecasts are often wrong, especially at turning points.
This is also why two websites can show different P/Es for the same stock. One may use standalone EPS, another consolidated; one may use the last financial year, another the last four quarters. Check which before comparing.
A low P/E means the market expects something unpleasant. Sometimes the market is wrong. Often it isn't.
A high P/E is the market paying up for growth it expects. Sometimes that's sensible.
Take a hypothetical Company B with EPS of ₹10 and a share price of ₹400, so P/E is 40. Expensive? If its earnings grow 25% a year for five years, EPS becomes roughly ₹30.5 (₹10 multiplied by 1.25 five times). At today's ₹400 price, that's a P/E of about 13 on year-five earnings. Someone who paid 40 times trailing earnings was really paying 13 times future earnings.
The catch is the "if". When a high-P/E company grows slower than hoped, the market tends to cut the multiple, and the share price can fall even while profits are still rising. High P/E means high expectations, and expectations are fragile.
The PEG ratio divides the P/E by the expected annual earnings growth rate, written as a plain number. Company B: P/E 40, growth 25%, PEG = 40 ÷ 25 = 1.6. A Company C with a P/E of 15 but growth of just 5% has a PEG of 3, which on this measure is the pricier of the two despite the lower P/E.
A PEG around 1 is often treated as fair value, a rule of thumb popularised by the fund manager Peter Lynch. Use it as a rough filter, not a verdict. The growth figure is an estimate. PEG ignores debt, dividends and the quality of earnings, and it breaks down for companies with very low or negative growth.
Different industries have different growth rates, capital needs and risks, so their "normal" P/Es are different too. Consumer goods companies with steady demand and high returns on capital have often traded at much higher P/Es than metal producers or many public sector companies. That doesn't make one automatically overpriced and the other a bargain.
Some sectors are better judged on other measures altogether. Banks and lenders are commonly compared on price-to-book value, because their earnings swing with bad-loan provisions. For a loss-making company, P/E is meaningless.
A fairer comparison is a company against its direct peers, and against its own P/E history over several years.
If you can answer those five, a P/E stops being a label and starts being a useful clue.
This article is for general education only and is not investment advice or a recommendation to buy or sell any security. All companies and figures in it are hypothetical, and past patterns do not guarantee future returns.


































© 2026 Promo Penny. All rights reserved
Designed & Developed by IngeniousPro Team.